ABC analysis helps a supply-chain team focus attention where value is concentrated. It ranks items by a chosen annual-value measure and groups them into A, B and C classes. In a traditional inventory study, that measure is annual usage multiplied by unit cost. This article uses positive sales value instead, because the public dataset has selling prices but no procurement costs. It is an original, reproducible teaching case—not a client engagement or evidence of inventory savings.
What did the retail case study find?
In 12 months of UK online-retail transactions, 825 of 3,786 product codes (21.8%) generated approximately 80.0% of positive product sales value. Another 963 codes generated 15.0%; the remaining 1,998 codes generated 5.0%. The pattern shows why equal review effort across every SKU can be inefficient, but the right action still depends on lead times, criticality and demand variability.
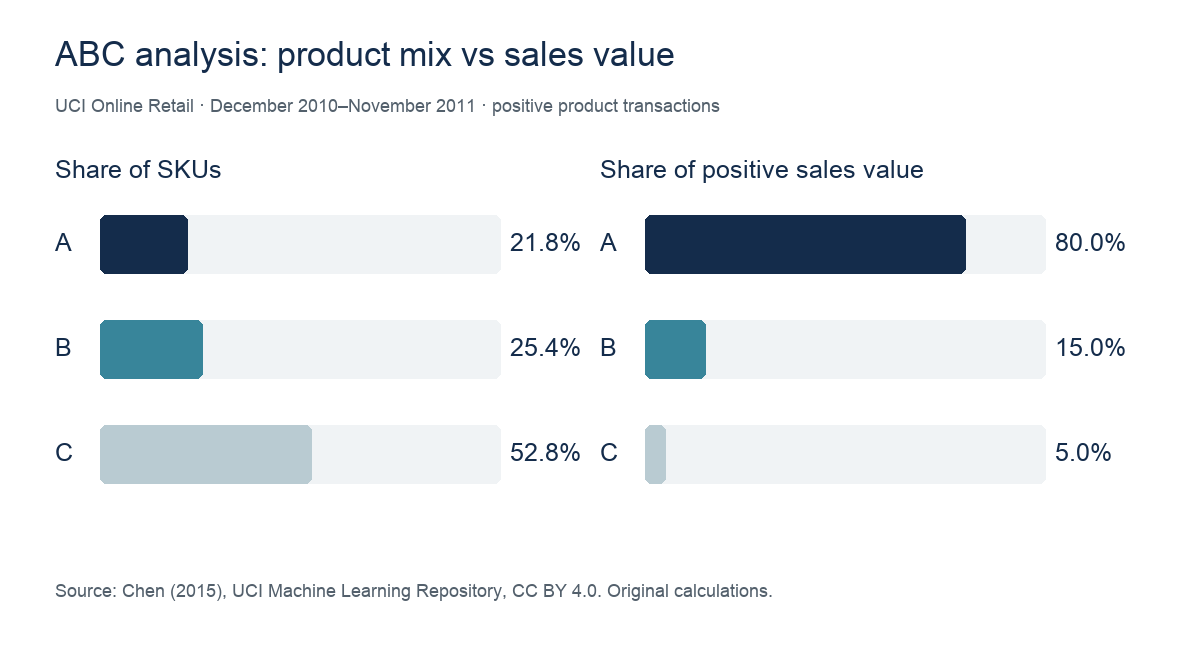
| Class | Product codes | Share of codes | Positive sales value | Share of value |
|---|---|---|---|---|
| A | 825 | 21.8% | £7,689,957 | 80.0% |
| B | 963 | 25.4% | £1,441,142 | 15.0% |
| C | 1,998 | 52.8% | £479,891 | 5.0% |
How was the analysis calculated?
- Choose a consistent period. I used invoices dated 1 December 2010 through 30 November 2011, inclusive of the first date and exclusive of 1 December 2011.
- Clean the transaction lines. From 541,909 source rows, 500,531 positive product lines remained after selecting the period and excluding cancellation invoices, non-positive quantities or prices, and service/non-product stock codes. This is not net revenue: returns and cancellations are omitted.
- Calculate product value. For each retained line, positive sales value = quantity × unit selling price. Sum this value by StockCode.
- Rank and classify. Sort product codes from highest to lowest value. Assign A until cumulative value reaches roughly 80%, B through roughly 95%, and C to the remainder. The item crossing a threshold stays in the earlier class, so shares may not equal exactly 80/15/5.
What could a team do with the result?
Use the A list as a review priority: validate forecasts more often, investigate exceptions, and consider more frequent cycle counts. B items may suit a regular review cadence; C items may permit simpler controls. These are management hypotheses, not measured outcomes from this dataset. A low-sales-value item can still be critical if it has a long replenishment lead time or causes a costly stockout.
Limits you should not overlook
The source contains transaction prices but not unit procurement costs, on-hand stock, supplier lead times, margins, or stockout events. Therefore this is a sales-value ABC segmentation, not a cost-based annual-consumption or inventory-investment calculation. It describes one historical retailer; it cannot prove that changing inventory policies would improve service or reduce cost. Combine ABC with demand-variability (XYZ), criticality, and lead-time analysis before setting policy.
Frequently asked questions
Does Class A always contain 20% of products?
No. The 80/20 rule is a heuristic, not a required distribution. In this case, 21.8% of product codes generated about 80% of the selected value measure.
Can this analysis set reorder points?
Not by itself. Reorder points need demand during lead time and an explicit service or safety-stock assumption. ABC helps decide which items deserve deeper analysis first.
Data and attribution
Source: UCI Machine Learning Repository, Online Retail (Daqing Chen, 2015; DOI: 10.24432/C5BW33), licensed under CC BY 4.0. Calculations, chart, wording and interpretation are original. For the conventional inventory-value definition of ABC, see ASCM’s inventory terminology.